Domain monitoring helps you catch important changes that can happen while a domain still resolves normally: registrar updates, expiration dates, nameservers, DNSSEC state, or DNS records that direct web and email traffic. Detecting those changes early can prevent downtime, missed renewal warnings, broken email delivery, and lengthy incident investigations.
Domain Monitoring in WhoisJsonAPI gives you one place to watch WHOIS/RDAP and DNS data, review a history of detected changes, and send alerts to people or systems that need to act. This guide explains how the feature works and walks through setting it up from the dashboard.
- What Domain Monitoring watches
- Tour the Domain Monitoring dashboard
- How to set up Domain Monitoring
- How to investigate a detected change
- Domain Monitoring webhooks: Send events to your application
- Add many monitors with Bulk Import
- Domain Monitoring best practices
- Domain Monitoring troubleshooting
- Start monitoring your domains
What Domain Monitoring watches
Each monitor belongs to one domain. You can enable either or both of these data sources:
- WHOIS/RDAP: registrar, expiration, domain status, nameservers, and DNSSEC-related changes.
- DNS: changes to A, AAAA, MX, NS, TXT, and CNAME records, including high-impact conditions such as all MX or all NS records being removed.
The first successful check establishes a baseline. It does not create a change event. Later completed snapshots are compared with that baseline, and meaningful differences become events in the monitor’s timeline. Checks run on the schedule included with your plan; the monitor detail page shows the last and next check times.
Events are classified as critical, important, or informational. Critical events cover high-risk changes that can affect ownership, DNSSEC, or expiration safety. Important events cover operational changes worth reviewing, such as registrar or DNS updates. Informational events provide lower-risk audit history. Every event appears in the dashboard, even when your email filter is set to alert only on critical and important changes.
Tour the Domain Monitoring dashboard
Open Dashboard → Monitoring. The summary at the top shows how many active monitors you are using. The table below gives you the operational state of every domain at a glance: enabled data sources, status, last check, last detected change, alert channel, and available actions.
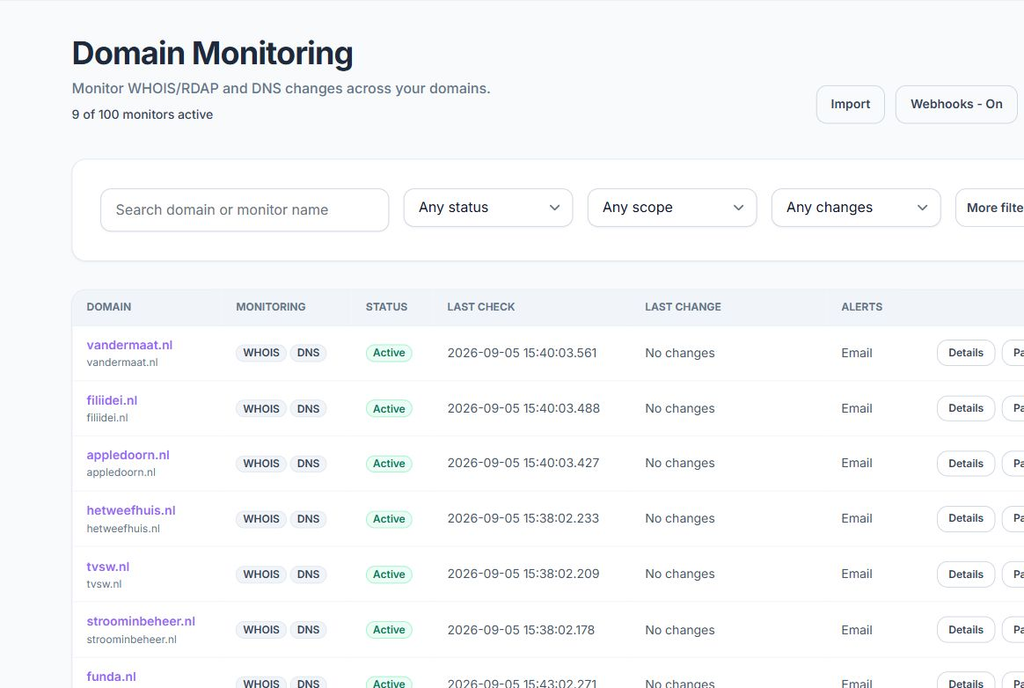
Use the search box to find a domain or monitor name. Filter by status, monitoring scope, or whether a change has been detected. More filters adds severity and tag filters, which is useful when your portfolio grows.
| Status | What it means |
|---|---|
| Initializing | The monitor is collecting its first successful WHOIS/RDAP or DNS baseline. |
| Active | Checks are running normally. |
| Paused | Scheduled checks and notifications are stopped until you resume the monitor. |
| Problem | A source read or scheduling step failed. The monitor remains eligible for later checks so transient problems can recover. |
How to set up Domain Monitoring
1. Open the setup panel
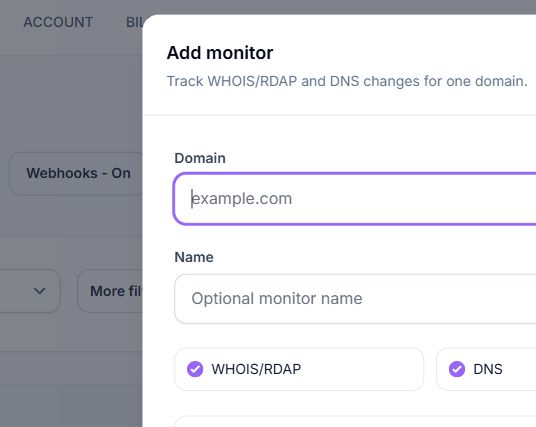
From the Monitoring dashboard, click + Add monitor. A setup panel opens without taking you away from the portfolio view.
2. Enter the domain and an optional name
Enter a domain such as example.com. Use the optional name to add business context—for example, “Primary website,” “Customer portal,” or “Transactional email domain.” The name is searchable from the main dashboard.
3. Choose the monitoring scope
Keep both WHOIS/RDAP and DNS selected for broad coverage, or select only the source that matters for this monitor. At least one source must be enabled.
4. Configure email alerts
Enable Email alerts, choose the recipient, and keep the current notification frequency set to Immediately. Your account email is already eligible while the account is active. A custom recipient must be verified before alerts can be delivered to it.
After creation, open the monitor’s Settings tab to choose one of two alert thresholds:
- Critical and important changes: reduces email noise while preserving every event in the dashboard timeline.
- All changes: also emails informational events.
5. Add the monitor
Click Add monitor. The new row will normally begin in Initializing while WhoisJsonAPI establishes the first baseline. Once baseline data is available, the status changes to Active. The baseline itself is not reported as a change.
How to investigate a detected change
Click a domain or Details in the monitor table. Four tabs organize the information:
- Overview summarizes health, schedule, recent change, notification activity, and the latest WHOIS/RDAP and DNS data.
- Changes provides the chronological event timeline.
- Current data shows the latest normalized WHOIS/RDAP and DNS summaries, with expandable JSON for deeper inspection.
- Settings lets you rename or tag the monitor, change its data sources, and adjust email behavior.
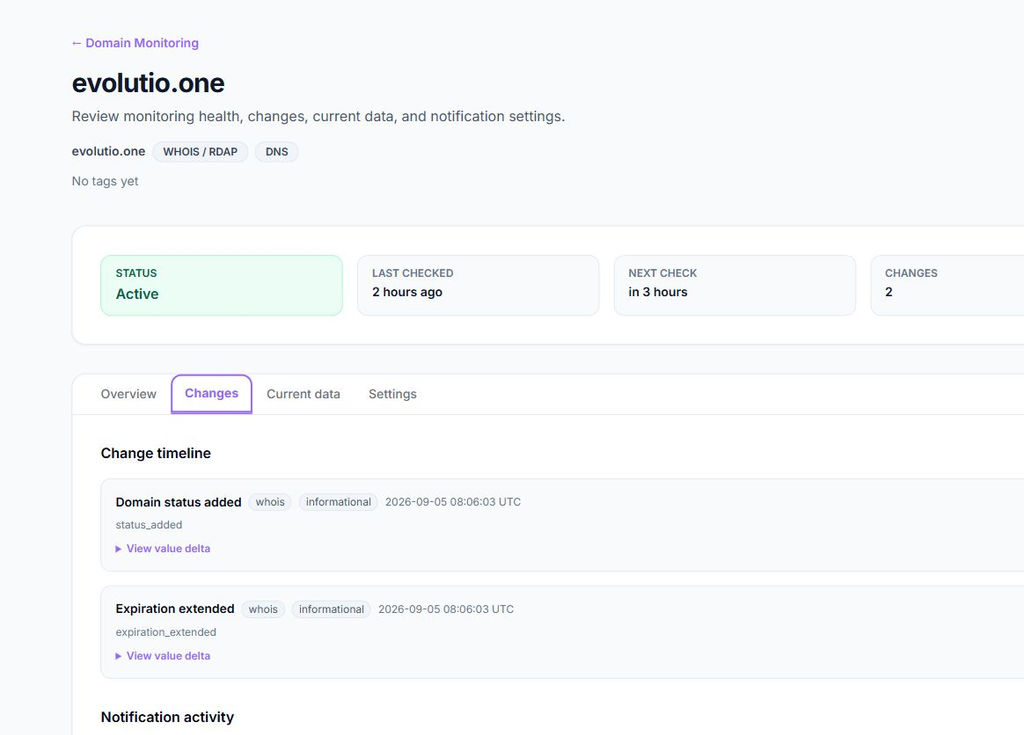
In the Changes tab, select View value delta to compare the previous value, current value, and structured difference. This is the fastest way to answer the practical question: “What exactly changed?” Notification activity on the same page shows whether an email attempt was sent or failed.
Domain Monitoring webhooks: Send events to your application
Email is useful for people; webhooks are better for automation. Select Webhooks from the Monitoring dashboard to configure one account-level HTTPS endpoint for events across all monitored domains.
- Enter the endpoint URL and save it.
- Choose WHOIS/RDAP, DNS, or both as event sources.
- Choose the severities your receiver should get.
- Deliver all event types or narrow the endpoint to selected types.
- Use Send test to verify connectivity before relying on live events.
Every delivery includes an HMAC-SHA256 signature calculated over the exact JSON request body. Verify it with the signing secret before trusting the request. The delivery history records the event, domain, HTTP result, timing, and attempt count. Retryable failures can be attempted up to five times, with delays of approximately 1 minute, 5 minutes, 30 minutes, and 2 hours after successive failures. You can also manually resend a delivery from its history.
Treat the webhook receiver as an at-least-once integration: use the event identity to make processing idempotent, return a successful HTTP status only after durable acceptance, and keep the signing secret out of logs.
Webhook payload and verification
A live delivery uses an HTTPS POST with a JSON body describing the event, the affected monitor, the previous and current values, and a link back to the dashboard. The example below shows a DNS A-record change; identifiers, addresses, and timestamps are illustrative.
{
  "event_id": "018f4d4a-7b8c-7a00-8000-000000000000",
  "event_type": "record_changed",
  "source": "dns",
  "severity": "important",
  "domain": "example.com",
  "detected_at": "2026-09-05T14:30:00+00:00",
  "monitor": {
    "id": 123,
    "name": "Production domain",
    "tags": ["production", "critical"]
  },
  "change": {
    "summary": "A records changed",
    "previous": [
      {"type": "A", "name": "example.com", "value": "203.0.113.10"}
    ],
    "current": [
      {"type": "A", "name": "example.com", "value": "203.0.113.20"}
    ]
  },
  "links": {
    "dashboard": "https://whoisjsonapi.com/dashboard/monitoring/123"
  },
  "test": false
}Use the accompanying headers to verify authenticity and identify deliveries:
X-WhoisJsonAPI-Event-Id: 018f4d4a-7b8c-7a00-8000-000000000000
X-WhoisJsonAPI-Delivery-Id: DELIVERY_ID
X-WhoisJsonAPI-Signature-SHA256: BASE64_HMAC_SHA256Verify the signature before parsing or trusting the payload. Compute a Base64-encoded HMAC-SHA256 over the exact raw request body using the signing secret, then compare the result with X-WhoisJsonAPI-Signature-SHA256 using a timing-safe comparison. Even harmless JSON reformatting changes the signature, so do not re-encode the body first.
$expectedSignature = base64_encode(
    hash_hmac('sha256', $rawRequestBody, $webhookSecret, true)
);

$isValid = hash_equals(
    $expectedSignature,
    $_SERVER['HTTP_X_WHOISJSONAPI_SIGNATURE_SHA256'] ?? ''
);Webhook delivery is at least once, so the receiver must tolerate duplicates. Use X-WhoisJsonAPI-Event-Id together with X-WhoisJsonAPI-Delivery-Id, or your own event identity policy, to deduplicate processing. Test deliveries use test as the event ID and set “test” to true in the payload.
Add many monitors with Bulk Import
For a portfolio, click Import on the Monitoring dashboard. You can paste one CSV-formatted row per line or upload a CSV file. Bulk import availability depends on your plan.
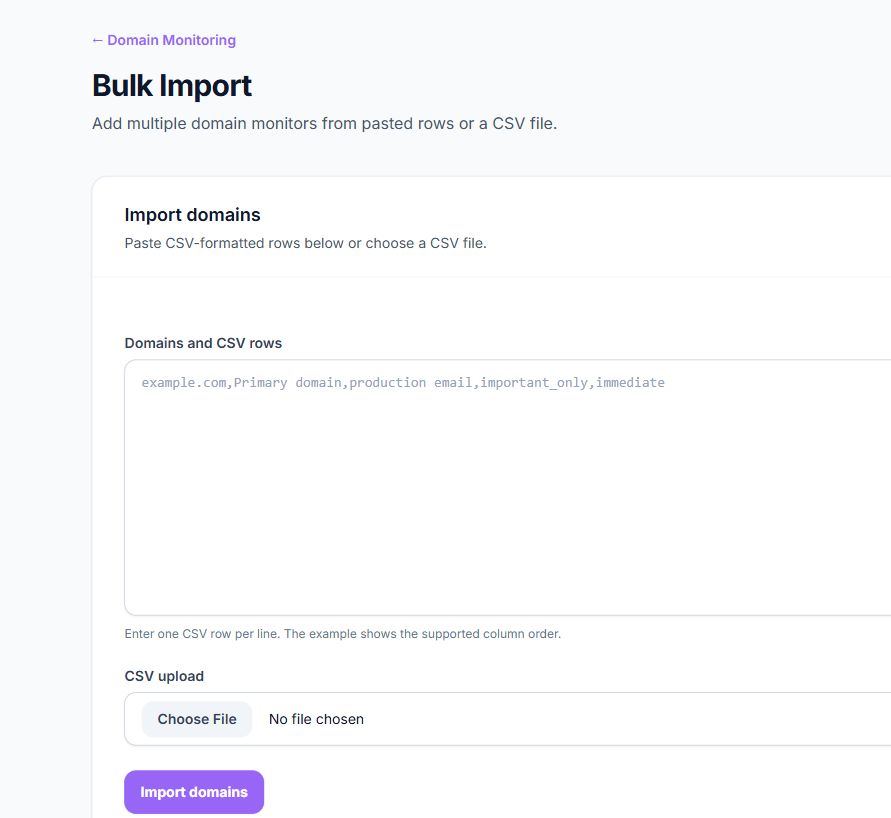
The supported column order is:
domain,monitor_name,tags,alert_level,email_modeFor example:
example.com,Primary domain,production,important_only,immediateUse important_only for critical and important email alerts or all for every severity. The current email mode is immediate. Uploaded CSV files may include a header row; pasted rows should follow the column order shown above. If a tag field contains CSV commas, quote that field.
After the import, review the result summary and row-level table. It distinguishes created and reactivated monitors from duplicates, invalid domains, and rows that exceed the plan limit.
Domain Monitoring best practices
- Monitor both sources for production domains. WHOIS/RDAP protects registration visibility; DNS monitoring protects routing and service configuration.
- Use names and tags consistently. Labels such as production, customer, email, and parked make filters useful during an incident.
- Start with critical and important email alerts. Use the dashboard for informational history, then switch selected high-value domains to all-change email if needed.
- Test the webhook and verify signatures. A saved URL is not proof that the receiver accepts and validates events.
- Pause instead of removing temporary monitors. Paused monitors stop checks and do not consume active-monitor capacity, while remaining available to resume.
- Review “Problem” monitors. They continue to retry, but repeated problems may indicate unavailable source data or a configuration issue that deserves attention.
Domain Monitoring troubleshooting
The monitor stays on Initializing
The feature needs a successful source snapshot before it can establish a baseline. Check the last and next check times. If the monitor later moves to Problem, open its details for health information and allow the next scheduled check to retry.
A change appears in the timeline, but no email arrived
Confirm that email alerts are enabled, the selected recipient is verified, and the event passes the monitor’s alert threshold. Informational events are still recorded when the monitor is configured for critical and important email only. Also check the notification activity and your spam filtering.
A webhook delivery failed
Open the delivery in webhook history and check the stored HTTP result and retry state. Fix the receiver, wait for the next eligible automatic attempt, or use Resend for an immediate separate delivery. Make sure the endpoint responds promptly and accepts duplicate-safe retries.
Start monitoring your domains
Domain changes are much easier to handle when you see them as they happen and retain the evidence needed to investigate. Open the Domain Monitoring dashboard, add your most important production and email domains first, and expand coverage from there.
Related: Best WHOIS APIs compared by features, pricing, and accuracy